
The price of any item is determined by the supply of that item, as well as the market demand. The National Association of REALTORS (NAR) surveys “over 50,000 real estate practitioners about their expectations for home sales, prices and market conditions” for their monthly REALTORS Confidence Index.
Their latest edition sheds some light on the relationship between Seller Traffic (supply) and Buyer Traffic (demand).
Buyer Demand
The map below was created after asking the question: “How would you rate buyer traffic in your area?” I am here to tell you, buyer traffic in Marlboro, NJ if still totally out of control. I can NOT believe the number of buyers who reach out to us specifically calling in for Marlboro, NJ.
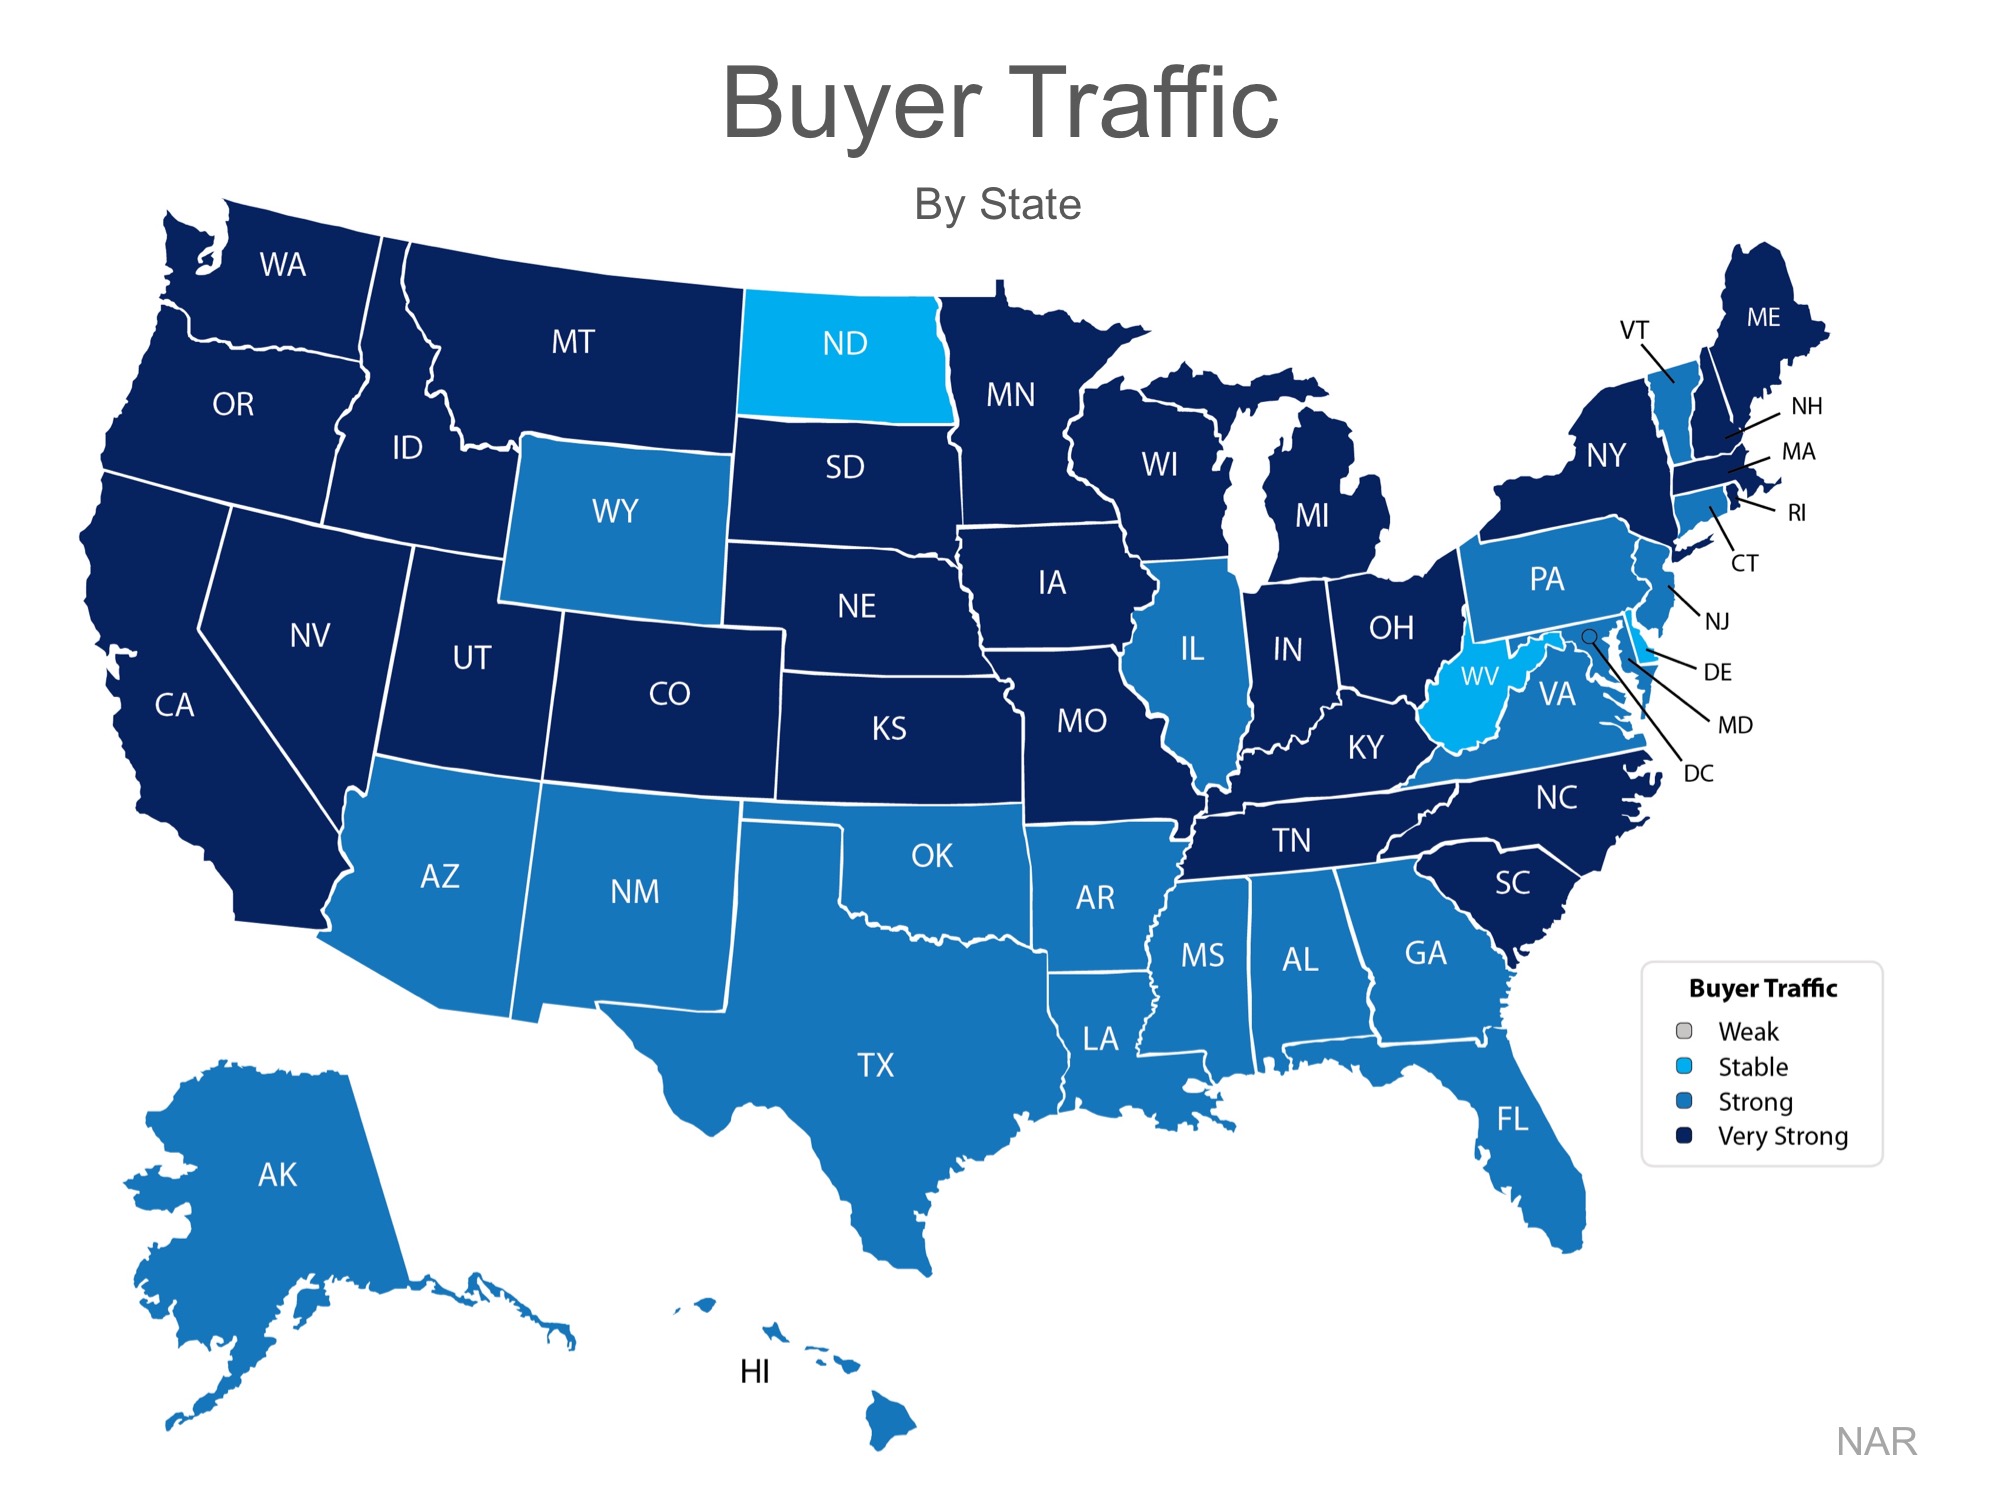
The darker the blue, the stronger the demand for homes in that area. Only three states had a ‘stable’ demand level.
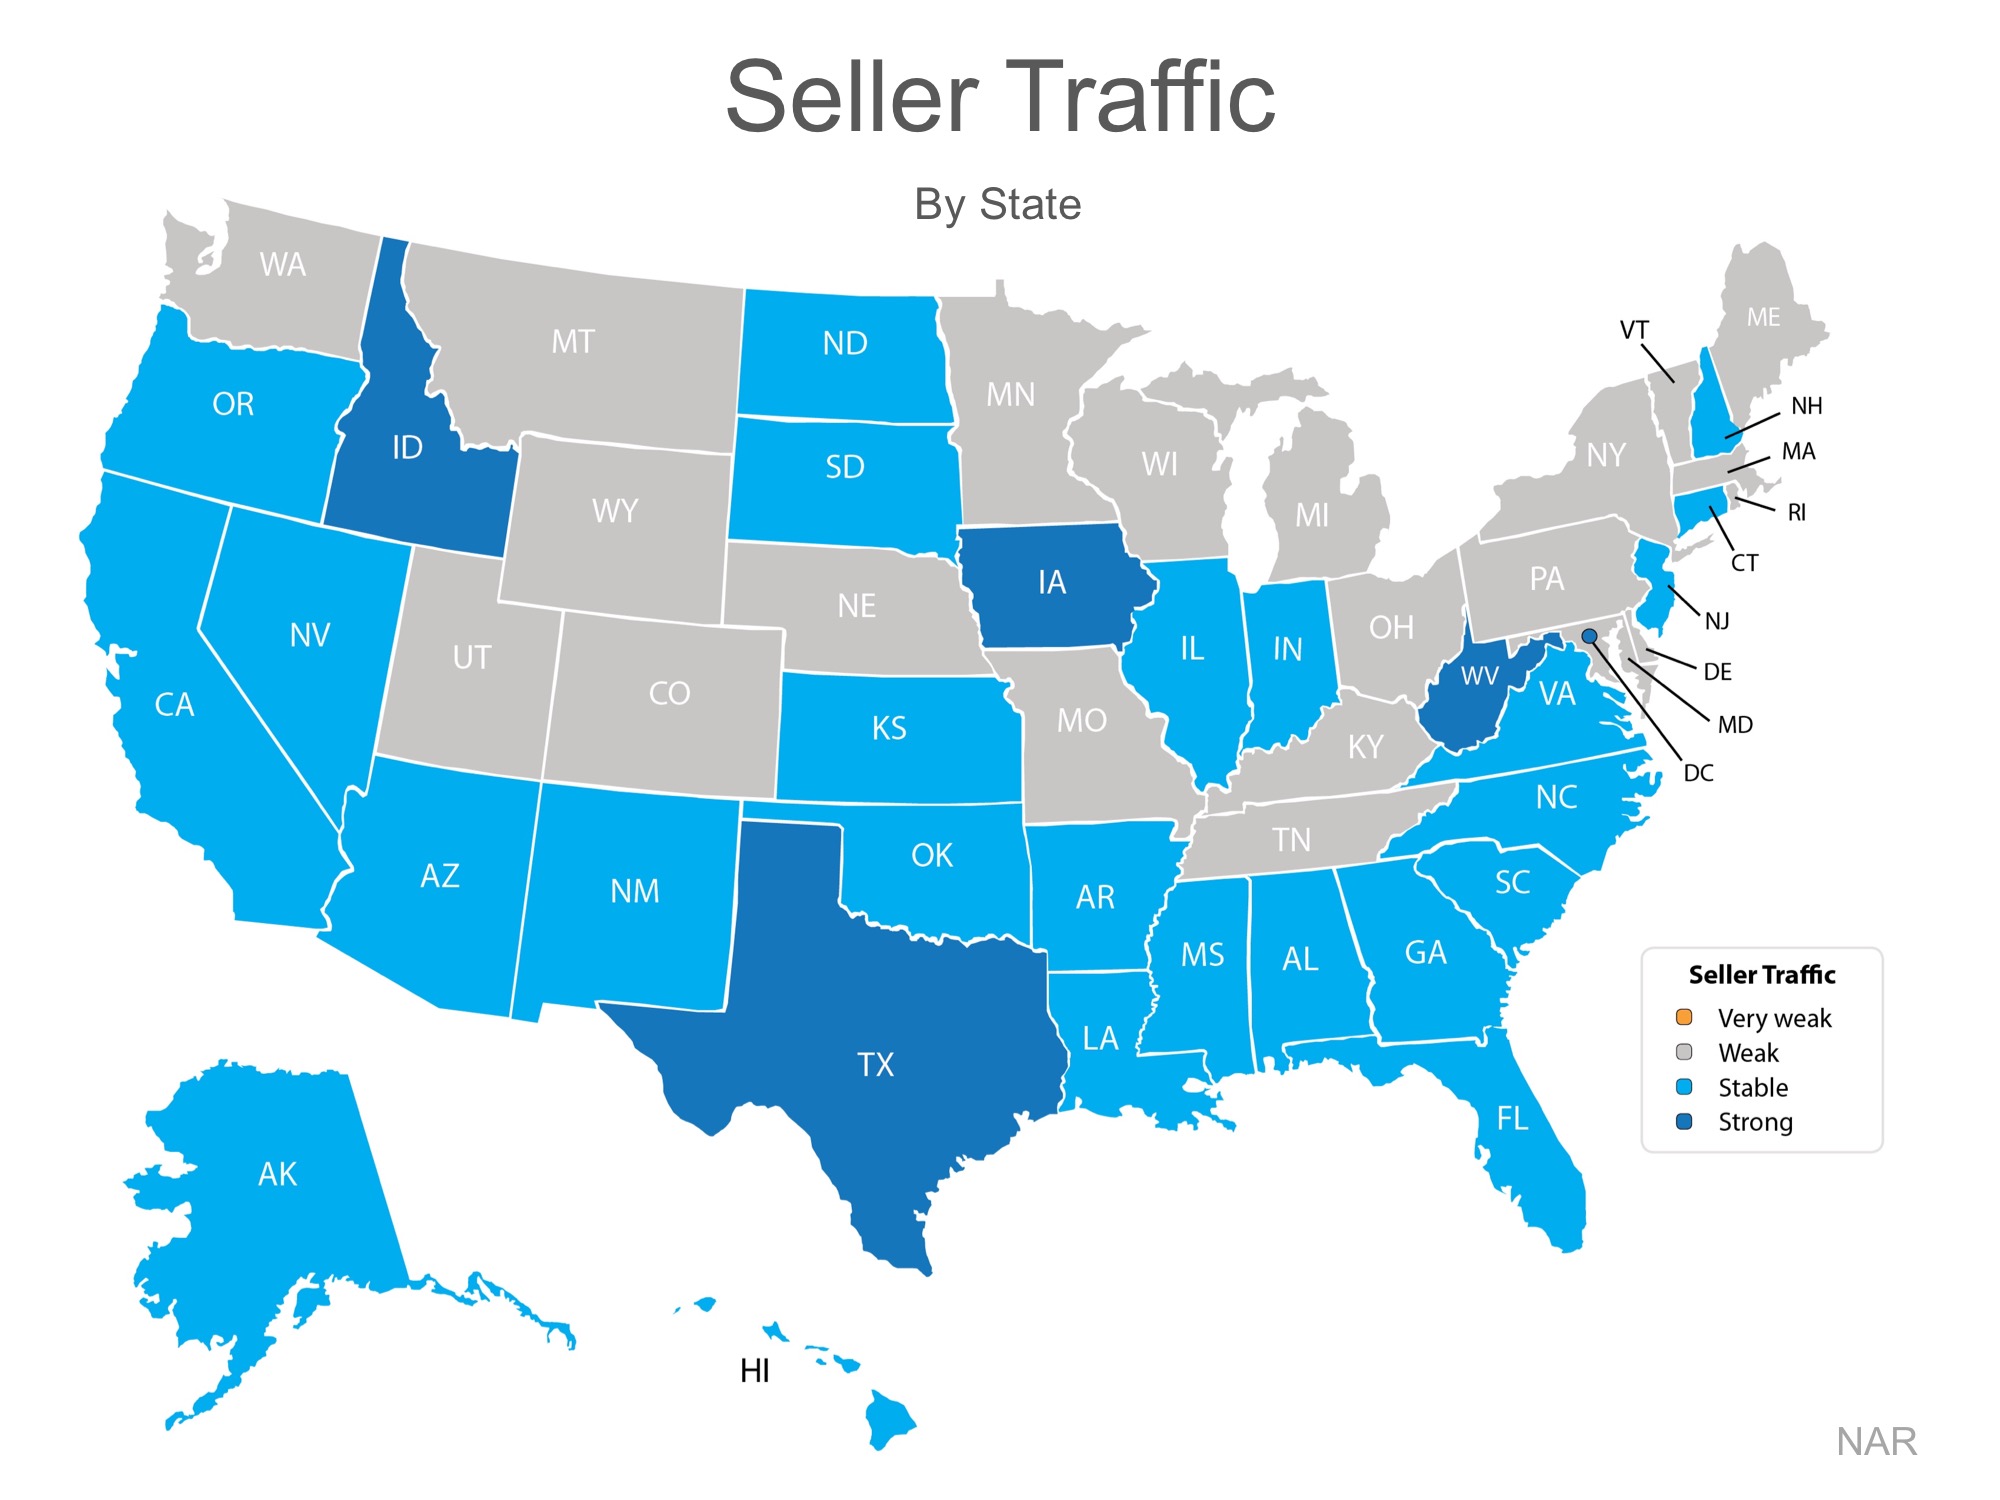
Seller Supply
The index also asked: “How would you rate seller traffic in your area?”
As you can see from the map below, 21 states report a ‘weak’ sellers traffic, 25 states report a ‘stable’ sellers traffic, only 4 states and DC report a ‘strong’ sellers traffic. Meaning there are far fewer homes on the market than what is needed to satisfy the buyers who are out looking for their dream homes. We feel the low supply here in Monmouth County and especially in Marlboro, NJ. There are literally buyers who are patiently waiting for something, anything to come on the market in Marlboro, NJ.
Bottom Line
Looking at the maps above, it is not hard to see why prices are appreciating in many areas of the country. Until the buyer demand is outpacing the supply of homes for sale, prices will continue to increase. If you are debating listing your home for sale, let’s get together to help you capitalize on the demand in the market now!
If you would like to see homes that are currently for sale in Marlboro, NJ please click here!
If you are thinking of moving to Marlboro, NJ please check here for some information about the area! Marlboro, NJ.
Do you have any questions? Don’t hesitate to message me!
